A Practical Guide To Observability Logs Metrics And Traces In Flutter
Summary
Summary

This guide shows how to instrument observability in Flutter apps for mobile development: structured logs with correlation IDs, lightweight metrics (counters/histograms), span-based traces for user flows, and best practices for batching, sampling, and exporting to backends while preserving privacy and device resources.

This guide shows how to instrument observability in Flutter apps for mobile development: structured logs with correlation IDs, lightweight metrics (counters/histograms), span-based traces for user flows, and best practices for batching, sampling, and exporting to backends while preserving privacy and device resources.

Key insights:
Key insights:
  • Instrumenting Logs In Flutter: Use structured logs and attach correlation IDs to link logs to traces and metrics.

  • Collecting Metrics: Record counters, gauges, and histograms with sane buckets; flush on lifecycle events to save battery and bandwidth.

  • Tracing Requests And User Flows: Create lightweight spans for UI and network operations, propagate trace IDs to backends for full correlation.

  • Correlating Logs, Metrics, And Traces: Ensure every telemetry item carries a trace_id; sample traces and avoid high-cardinality tags.

  • Export, Storage, And Backend Choices: Batch, compress, and authenticate telemetry; choose OpenTelemetry-compatible backends and respect privacy.

Introduction

Observability is essential for reliable Flutter apps in mobile development. Logs, metrics, and traces together give you the ability to detect, diagnose, and understand runtime behavior. This guide is practical and code-forward: you will learn how to instrument logs, capture meaningful metrics, trace user flows, correlate the signals, and export them to backends suitable for mobile production.

Instrumenting Logs In Flutter

Logs are the first, most direct signal. Use structured, contextual logs rather than free-form print statements. Prefer dart:developer.log for simple key/value context or a logging package for richer features. Include these elements in every log entry: timestamp, level, message, service/component, correlation_id, and lightweight payloads (errors, duration).

Example using dart:developer.log with structured fields:

import 'dart:developer' as developer;

void logEvent(String message, Map<String, Object?> context) {
  developer.log(message, name: 'com.example.app', error: null, stackTrace: null, sequenceNumber: DateTime.now().microsecondsSinceEpoch, zone: Zone.current, level: 800);
}

// Usage
logEvent('Button pressed', {'screen': 'Home', 'buttonId': 'checkout'});

Keep logs local and rate-limited on-device. For production, batch and send only samples or error-level logs to reduce network and battery cost. Always attach a correlation_id to relate logs to traces and metrics.

Collecting Metrics

Metrics are aggregated numerical measurements: counters, gauges, histograms. On mobile, instrument high-value metrics: app start time, screen render latency, API call durations, error rates, memory and battery usage. Use simple in-app collectors and export periodically.

Implement counters and histograms with minimal overhead. Example pattern: increment counters and record durations with a lightweight recorder, then flush to a backend in background or on app lifecycle events.

final Map<String, int> counters = {};

void increment(String name, [int delta = 1]) => counters[name] = (counters[name] ?? 0) + delta;

void recordDuration(String name, Duration duration) {
  // add to a histogram/bucket in your exporter
}

Design histograms with sensible buckets for mobile latencies (e.g., <100ms, 100–300ms, 300–1000ms, >1s). Aggregate on-device and export summarized deltas to reduce telemetry volume. Use application lifecycle hooks (paused, resumed) to trigger flushes so you don't lose metrics.

Tracing Requests And User Flows

Distributed-like tracing in mobile is about correlating operations across components (UI, background tasks, network). You do not need full-fledged backend traces to gain value: create trace IDs, span IDs, parent relationships, and durations, then attach them to network calls and logs.

Instrument common spans: cold start, screen load, network request, database write. Propagate trace IDs in HTTP headers for backend correlation. A minimal span model is: id, parentId, name, startTime, endTime, attributes.

Span creation pattern (conceptual): start a span before an operation, stop it after, record attributes and status. Export spans in batches to your trace collector or include them in error reports.

Correlating Logs, Metrics, And Traces

The largest operational gain comes from correlation. Every signal should carry a correlation_id or trace_id. When an error occurs, you should be able to jump from a log entry to the trace and to aggregated metrics (e.g., seeing that a particular API’s 95th percentile latency rose at the same time as error rate).

Best practices:

  • Generate and persist a per-session trace_id and attach it to all logs and metric events.

  • Tag metrics with dimensions that matter (screen, user_cohort, network_type) but avoid high-cardinality tags like raw user IDs unless sampled.

  • Sample traces: capture all error traces but sample normal traces based on budget.

  • Respect user privacy and GDPR: never log PII, and offer opt-out for telemetry.

Export, Storage, And Backend Choices

Choose a backend that supports logs, metrics, and traces (e.g., OpenTelemetry-compatible collectors, commercial APMs). For mobile development, prioritize: low-bandwidth exporters, batching, compression, and offline queuing. Securely transmit data (TLS), authenticate requests, and provide an SDK-side throttling policy.

Conclusion

Observability in Flutter and mobile development is a combination of lightweight on-device instrumentation and thoughtful export/aggregation. Start with structured logs and correlation IDs, add metrics with sensible buckets and lifecycle-aware flushing, and implement span-based traces for user flows and network operations. Correlate signals in your backend to accelerate root-cause analysis while preserving battery and network budgets on-device. Implement sampling, batching, and privacy filters before shipping to production.

Vibe Studio
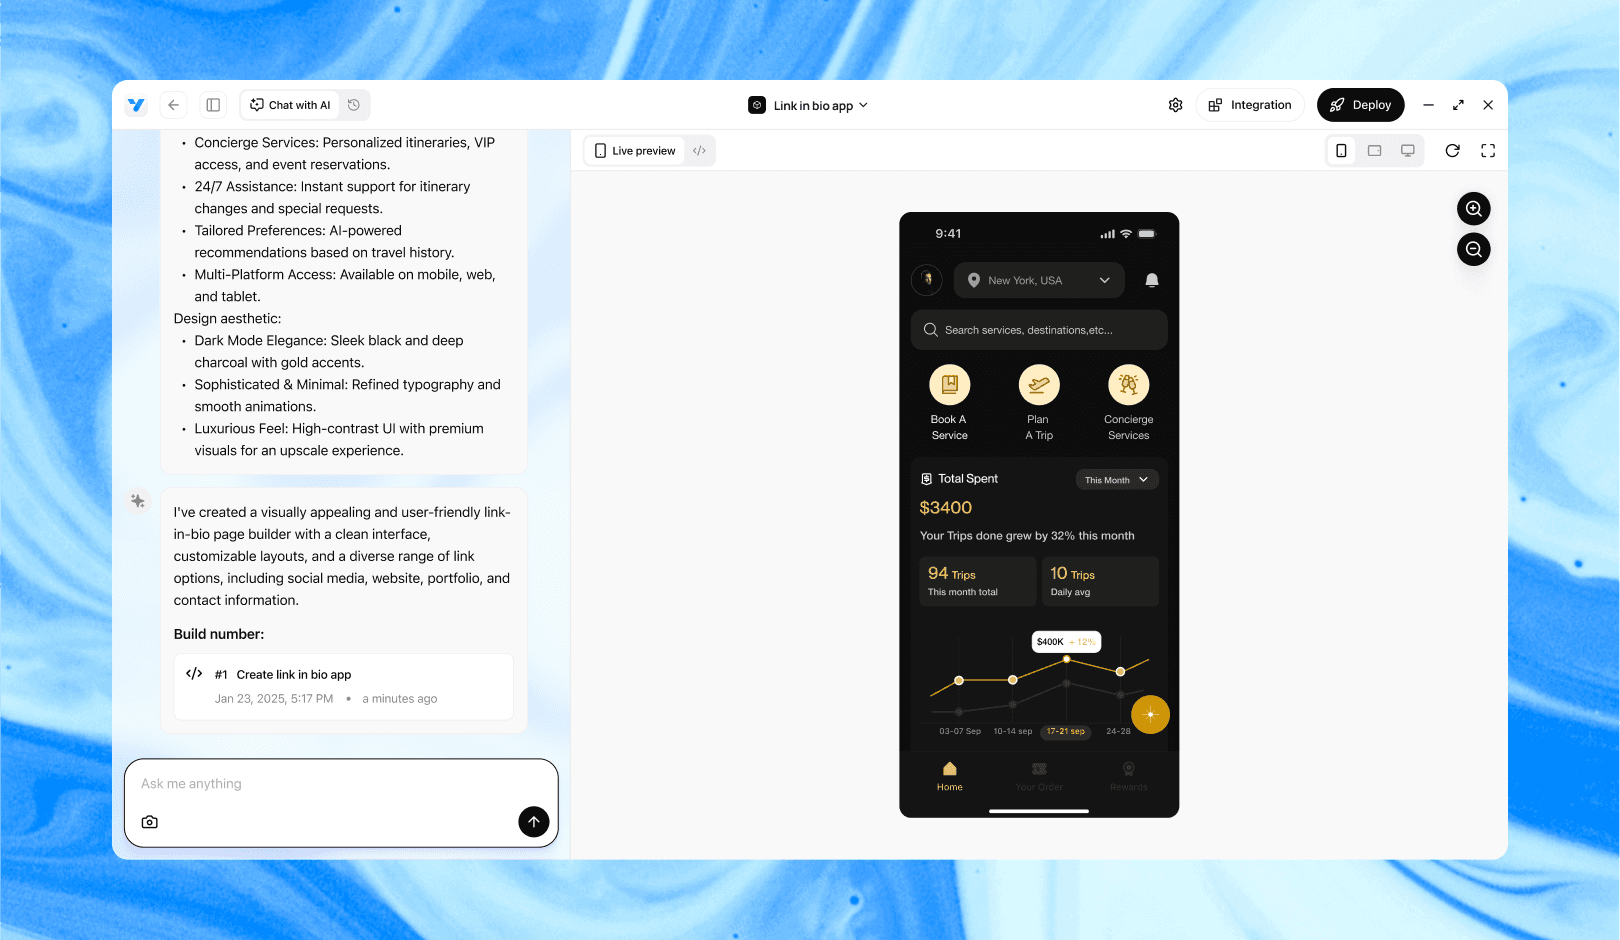
Vibe Studio, powered by Steve’s advanced AI agents, is a revolutionary no-code, conversational platform that empowers users to quickly and efficiently create full-stack Flutter applications integrated seamlessly with Firebase backend services. Ideal for solo founders, startups, and agile engineering teams, Vibe Studio allows users to visually manage and deploy Flutter apps, greatly accelerating the development process. The intuitive conversational interface simplifies complex development tasks, making app creation accessible even for non-coders.


Introduction

Observability is essential for reliable Flutter apps in mobile development. Logs, metrics, and traces together give you the ability to detect, diagnose, and understand runtime behavior. This guide is practical and code-forward: you will learn how to instrument logs, capture meaningful metrics, trace user flows, correlate the signals, and export them to backends suitable for mobile production.

Instrumenting Logs In Flutter

Logs are the first, most direct signal. Use structured, contextual logs rather than free-form print statements. Prefer dart:developer.log for simple key/value context or a logging package for richer features. Include these elements in every log entry: timestamp, level, message, service/component, correlation_id, and lightweight payloads (errors, duration).

Example using dart:developer.log with structured fields:

import 'dart:developer' as developer;

void logEvent(String message, Map<String, Object?> context) {
  developer.log(message, name: 'com.example.app', error: null, stackTrace: null, sequenceNumber: DateTime.now().microsecondsSinceEpoch, zone: Zone.current, level: 800);
}

// Usage
logEvent('Button pressed', {'screen': 'Home', 'buttonId': 'checkout'});

Keep logs local and rate-limited on-device. For production, batch and send only samples or error-level logs to reduce network and battery cost. Always attach a correlation_id to relate logs to traces and metrics.

Collecting Metrics

Metrics are aggregated numerical measurements: counters, gauges, histograms. On mobile, instrument high-value metrics: app start time, screen render latency, API call durations, error rates, memory and battery usage. Use simple in-app collectors and export periodically.

Implement counters and histograms with minimal overhead. Example pattern: increment counters and record durations with a lightweight recorder, then flush to a backend in background or on app lifecycle events.

final Map<String, int> counters = {};

void increment(String name, [int delta = 1]) => counters[name] = (counters[name] ?? 0) + delta;

void recordDuration(String name, Duration duration) {
  // add to a histogram/bucket in your exporter
}

Design histograms with sensible buckets for mobile latencies (e.g., <100ms, 100–300ms, 300–1000ms, >1s). Aggregate on-device and export summarized deltas to reduce telemetry volume. Use application lifecycle hooks (paused, resumed) to trigger flushes so you don't lose metrics.

Tracing Requests And User Flows

Distributed-like tracing in mobile is about correlating operations across components (UI, background tasks, network). You do not need full-fledged backend traces to gain value: create trace IDs, span IDs, parent relationships, and durations, then attach them to network calls and logs.

Instrument common spans: cold start, screen load, network request, database write. Propagate trace IDs in HTTP headers for backend correlation. A minimal span model is: id, parentId, name, startTime, endTime, attributes.

Span creation pattern (conceptual): start a span before an operation, stop it after, record attributes and status. Export spans in batches to your trace collector or include them in error reports.

Correlating Logs, Metrics, And Traces

The largest operational gain comes from correlation. Every signal should carry a correlation_id or trace_id. When an error occurs, you should be able to jump from a log entry to the trace and to aggregated metrics (e.g., seeing that a particular API’s 95th percentile latency rose at the same time as error rate).

Best practices:

  • Generate and persist a per-session trace_id and attach it to all logs and metric events.

  • Tag metrics with dimensions that matter (screen, user_cohort, network_type) but avoid high-cardinality tags like raw user IDs unless sampled.

  • Sample traces: capture all error traces but sample normal traces based on budget.

  • Respect user privacy and GDPR: never log PII, and offer opt-out for telemetry.

Export, Storage, And Backend Choices

Choose a backend that supports logs, metrics, and traces (e.g., OpenTelemetry-compatible collectors, commercial APMs). For mobile development, prioritize: low-bandwidth exporters, batching, compression, and offline queuing. Securely transmit data (TLS), authenticate requests, and provide an SDK-side throttling policy.

Conclusion

Observability in Flutter and mobile development is a combination of lightweight on-device instrumentation and thoughtful export/aggregation. Start with structured logs and correlation IDs, add metrics with sensible buckets and lifecycle-aware flushing, and implement span-based traces for user flows and network operations. Correlate signals in your backend to accelerate root-cause analysis while preserving battery and network budgets on-device. Implement sampling, batching, and privacy filters before shipping to production.

Vibe Studio

Vibe Studio, powered by Steve’s advanced AI agents, is a revolutionary no-code, conversational platform that empowers users to quickly and efficiently create full-stack Flutter applications integrated seamlessly with Firebase backend services. Ideal for solo founders, startups, and agile engineering teams, Vibe Studio allows users to visually manage and deploy Flutter apps, greatly accelerating the development process. The intuitive conversational interface simplifies complex development tasks, making app creation accessible even for non-coders.

Build Flutter Apps Faster with Vibe Studio

Vibe Studio is your AI-powered Flutter development companion. Skip boilerplate, build in real-time, and deploy without hassle. Start creating apps at lightning speed with zero setup.

Other Insights

Join a growing community of builders today

Join a growing community of builders today

Join a growing community of builders today

Join a growing community of builders today

Join a growing community of builders today

28-07 Jackson Ave

Walturn

New York NY 11101 United States

© Steve • All Rights Reserved 2025

28-07 Jackson Ave

Walturn

New York NY 11101 United States

© Steve • All Rights Reserved 2025

28-07 Jackson Ave

Walturn

New York NY 11101 United States

© Steve • All Rights Reserved 2025

28-07 Jackson Ave

Walturn

New York NY 11101 United States

© Steve • All Rights Reserved 2025

28-07 Jackson Ave

Walturn

New York NY 11101 United States

© Steve • All Rights Reserved 2025

28-07 Jackson Ave

Walturn

New York NY 11101 United States

© Steve • All Rights Reserved 2025